Description
Size: 1.75 GB
Learning Objectives
- How to use Z-scores to display outliers and use the Outlier Detection visualization from Microsoft
- How to use Power BI’s Anomaly Detection and Fluctuation Analysis functionality
- Use time-series forecasting to predict future data points with varying degrees of certainty
- Use groups to classify categorical data and bins to categorize continuous data
- Learn about Key Influencers
- Use the Decomposition tree to drill down into a metric manually using known factors or let AI functionality determine which factors are the major contributors
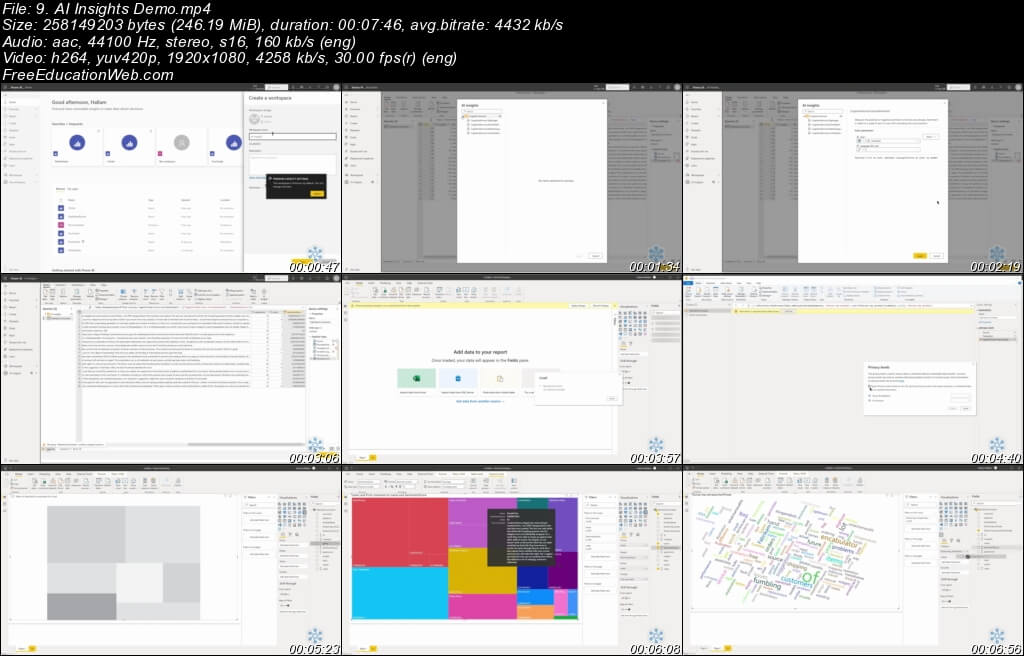
- Use the power of Azure’s AI and machine learning to analyze text for positive and negative sentiment, keywords and phrases, and image tagging


